
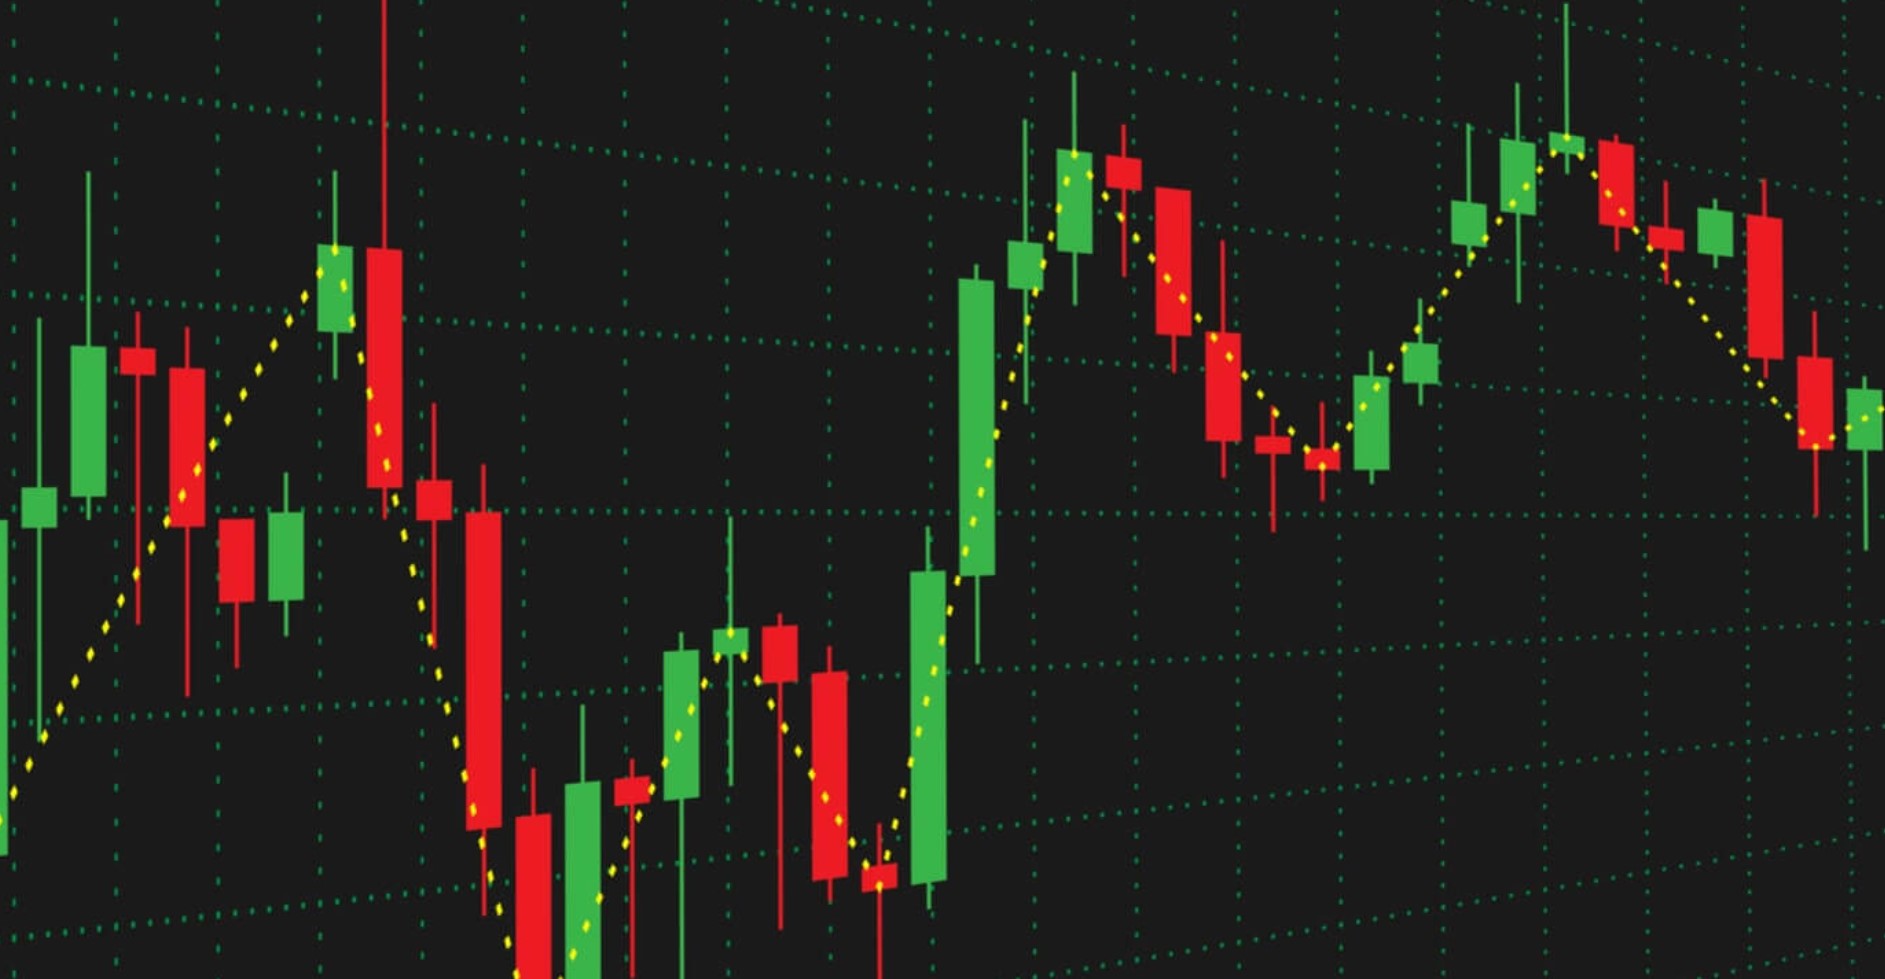
Candlestick patterns are visual representations of price movements in financial markets. They provide valuable information about market sentiment, helping traders identify potential reversals or continuations in price trends. Each candlestick represents a specific time period (e.g., 1 minute, 1 hour, 1 day) and consists of four main components: the opening price, closing price, high price, and low price.
Why are Candlestick Patterns Important?
Candlestick patterns offer several advantages over traditional bar charts or line charts. They provide a more comprehensive view of price action, making it easier to identify patterns and trends. Additionally, candlestick patterns can indicate potential reversals or continuations in the market, allowing traders to make informed decisions and manage risk effectively.
The History of Candlestick Patterns
Candlestick charting originated in Japan in the 18th century and was initially used to analyze the price movements of rice contracts. The method was later introduced to the Western world by Steve Nison, who popularized candlestick patterns with his book “Japanese Candlestick Charting Techniques.” Since then, candlestick patterns have become a widely used tool in technical analysis.
Basic Components of a Candlestick
To understand candlestick patterns, it’s essential to grasp the basic components of a candlestick. Each candlestick has a body and two wicks (also known as shadows). The body represents the price range between the opening and closing prices, while the wicks indicate the high and low prices reached during the time period.
A candlestick consists of the following components:
- Body: The body of a candlestick represents the price range between the opening and closing prices. It is typically colored, with different colors indicating whether the candle is bullish or bearish. A bullish candle has a green or white body, indicating that the closing price is higher than the opening price. Conversely, a bearish candle has a red or black body, indicating that the closing price is lower than the opening price.
- Wicks/Shadows: Also known as shadows, the wicks of a candlestick represent the high and low prices reached during the time period. The upper wick extends from the top of the body to the high price, while the lower wick extends from the bottom of the body to the low price. The length of the wicks provides valuable information about price volatility and the trading range.
- Opening Price: The opening price is the first price at which a financial instrument or asset trades during the time period represented by the candlestick. It is marked by the location of the body.
- Closing Price: The closing price is the last price at which a financial instrument or asset trades during the time period. It is also marked by the location of the body. The relationship between the opening and closing prices determines the color and size of the body, indicating whether the candlestick is bullish or bearish.
Bullish Candlestick Patterns
Bullish candlestick patterns suggest a potential uptrend or bullish reversal in the market. These patterns often indicate buying pressure and bullish sentiment among traders. Examples of bullish candlestick patterns include the Hammer, Morning Star, and Three White Soldiers.
Bearish Candlestick Patterns
Bearish candlestick patterns, on the other hand, indicate a potential downtrend or bearish reversal. These patterns suggest selling pressure and bearish sentiment among traders. Examples of bearish candlestick patterns include the Shooting Star, Evening Star, and Three Black Crows.
Reversal Candlestick Patterns
Reversal candlestick patterns signal a potential change in the direction of the market trend. They are essential for traders looking to identify turning points and take advantage of trend reversals. Reversal patterns include the Hammer, Shooting Star, Engulfing Pattern, and Harami.
Continuation Candlestick Patterns
Continuation candlestick patterns suggest that the current trend is likely to continue. Traders can use these patterns to confirm the ongoing trend and consider adding to their positions. Examples of continuation patterns include the Rising Wedge, Falling Wedge, and Pennant.
Doji Candlestick Pattern
The Doji candlestick pattern represents indecision in the market. It occurs when the opening and closing prices are very close or equal, resulting in a small or nonexistent body. Doji patterns indicate that buyers and sellers are in equilibrium and that a potential trend reversal may occur.
Hammer and Hanging Man Candlestick Patterns
The Hammer and Hanging Man patterns are characterized by a small body and a long lower wick. The Hammer is a bullish pattern that occurs at the bottom of a downtrend, indicating a potential trend reversal. The Hanging Man is a bearish pattern that appears at the top of an uptrend, suggesting a potential bearish reversal.
Shooting Star and Inverted Hammer Candlestick Patterns
The Shooting Star and Inverted Hammer are two candlestick patterns that share similarities but have opposite implications. The Shooting Star pattern is a bearish reversal pattern that occurs at the top of an uptrend. It consists of a small body located at the lower end of the candlestick, with a long upper wick that is at least twice the size of the body. This pattern suggests that the bulls were initially in control but lost momentum, and the bears managed to push the price down significantly by the end of the period. On the other hand, the Inverted Hammer pattern is a bullish reversal pattern that appears at the bottom of a downtrend. It is characterized by a small body located at the upper end of the candlestick, with a long lower wick that is at least twice the size of the body. This pattern indicates that the bears were initially in control but lost strength, and the bulls managed to drive the price up significantly. Both patterns are considered important signals for potential trend reversals and should be confirmed by other technical indicators or price action before making trading decisions.
| Shooting Star | Inverted Hammer | |
| Type of Pattern | Bearish reversal | Bullish reversal |
| Occurrence | At the top of an uptrend | At the bottom of a downtrend |
| Body Position | Small body at the lower end | Small body at the upper end |
| Wick Position | Long upper wick, at least twice the body | Long lower wick, at least twice the body |
| Interpretation | Bears gaining control, trend reversal | Bulls gaining control, trend reversal |
| Confirmation Needed | Other indicators or price action | Other indicators or price action |
Engulfing Candlestick Patterns
Engulfing patterns occur when a larger candle fully engulfs the body of the previous candle. A Bullish Engulfing Pattern forms when a small bearish candle is followed by a larger bullish candle, suggesting a potential bullish reversal. A Bearish Engulfing Pattern, on the other hand, forms when a small bullish candle is followed by a larger bearish candle, indicating a potential bearish reversal.
Morning Star and Evening Star Candlestick Patterns
The Morning Star and Evening Star patterns consist of three candles and are considered strong reversal indicators. The Morning Star is a bullish pattern that forms after a downtrend, signaling a potential trend reversal. The Evening Star is a bearish pattern that occurs after an uptrend, suggesting a potential bearish reversal.
Three White Soldiers and Three Black Crows Candlestick Patterns
Three White Soldiers is a bullish pattern that appears during a downtrend and consists of three consecutive long bullish candles. It suggests a strong shift in sentiment from bearish to bullish. Three Black Crows, on the other hand, is a bearish pattern that occurs during an uptrend and consists of three consecutive long bearish candles. It indicates a potential trend reversal to the downside.